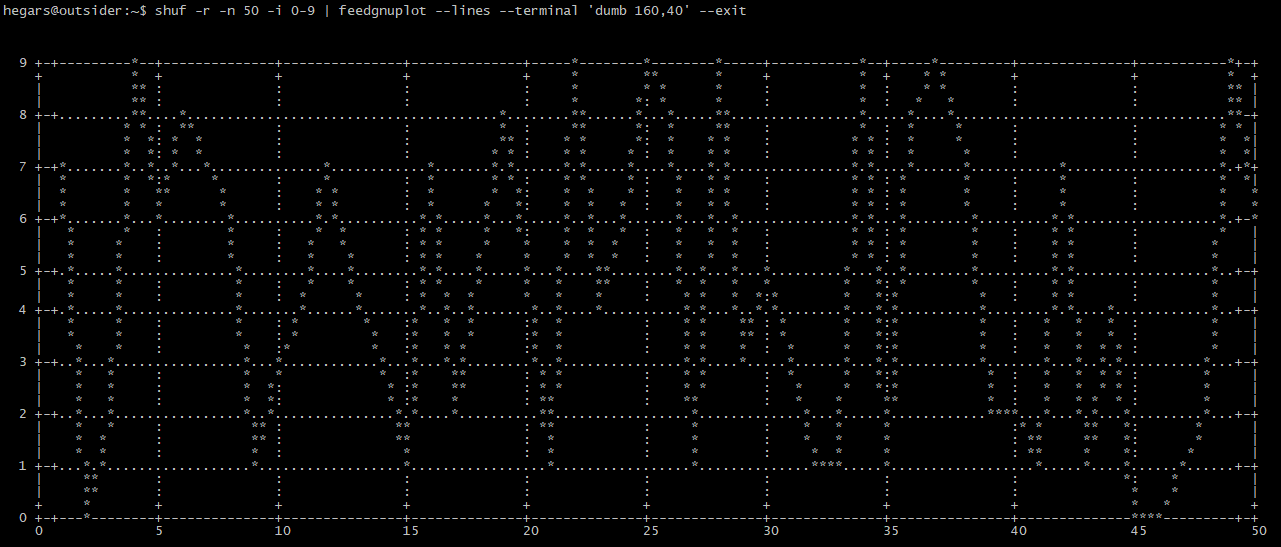
Using GNUPLOT (feedgnuplot for pipe loading) and SHUF (for sample data) to generate graphs on a console
shuf -r -n 50 -i 0-9 | feedgnuplot --lines --terminal 'dumb 160,40' --exit

Using GNUPLOT (feedgnuplot for pipe loading) and SHUF (for sample data) to generate graphs on a console
shuf -r -n 50 -i 0-9 | feedgnuplot --lines --terminal 'dumb 160,40' --exit